
Premium components
SparkChart Ring
Getting started
Premium components
Beta features
Deprecated components
Managed Cloud
Premium feature
This is a premium feature which requires a paid plan to be used. See here for more details.
SparkChart Ring
SparkCharts are a group of data visualization components intended for visualising trends in data, with less precision than ordinary data visualisation components.
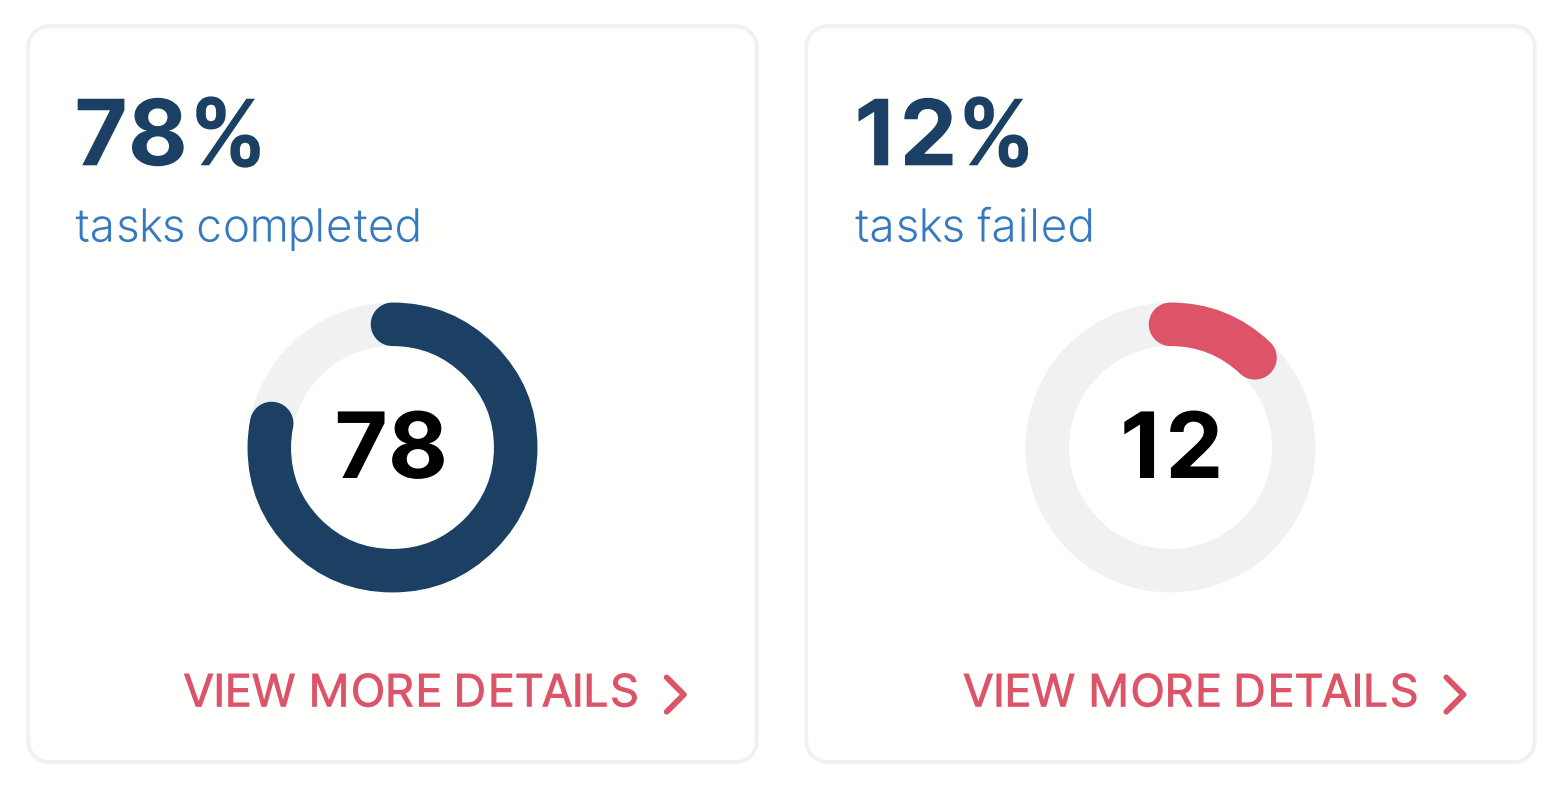
The SparkChart Ring component allows you to visualise data in a doughnut ring, with common use cases including progress of a certain task.
Example JSON
Below are two examples of the JSON required to define the component:
{
    "type": "SparkChart.Ring",
    "options": {
        "width": "1/4",
        "radius": 50,
        "value": 78,
        "stroke_width": 15,
        "title": "78%",
        "chart_color": "headline",
        "subtitle": "tasks completed",
        "button_link": "https://www.google.com",
        "button_text": "View more details"
    }
},
{
    "type": "SparkChart.Ring",
    "options": {
        "width": "1/4",
        "radius": 50,
        "value": 78,
        "stroke_width": 15,
        "title": "78%",
        "chart_color": "headline",
        "subtitle": "tasks completed",
        "button_link": "https://www.google.com",
        "button_text": "View more details"
    }
}
Options
| Key | Description |
|---|---|
value | Value representing the percentage of ring to be filled in. Between 0 and 100. |
title | Typically used to show the latest numerical value from the data. |
subtitle | Often used to describe the value or provide units. |
Example
Missing something?
Hybiscus is continuously improving and adding new features. If you think we are missing a critical feature, please do not hesitate to contact us and offer your feedback at support@hybiscus.dev