
Premium components
SparkChart Line
Getting started
Premium components
Beta features
Deprecated components
Managed Cloud
Premium feature
This is a premium feature which requires a paid plan to be used. See here for more details.
SparkChart Line
SparkCharts are a group of data visualization components intended for visualising trends in data, with less precision than ordinary data visualisation components.
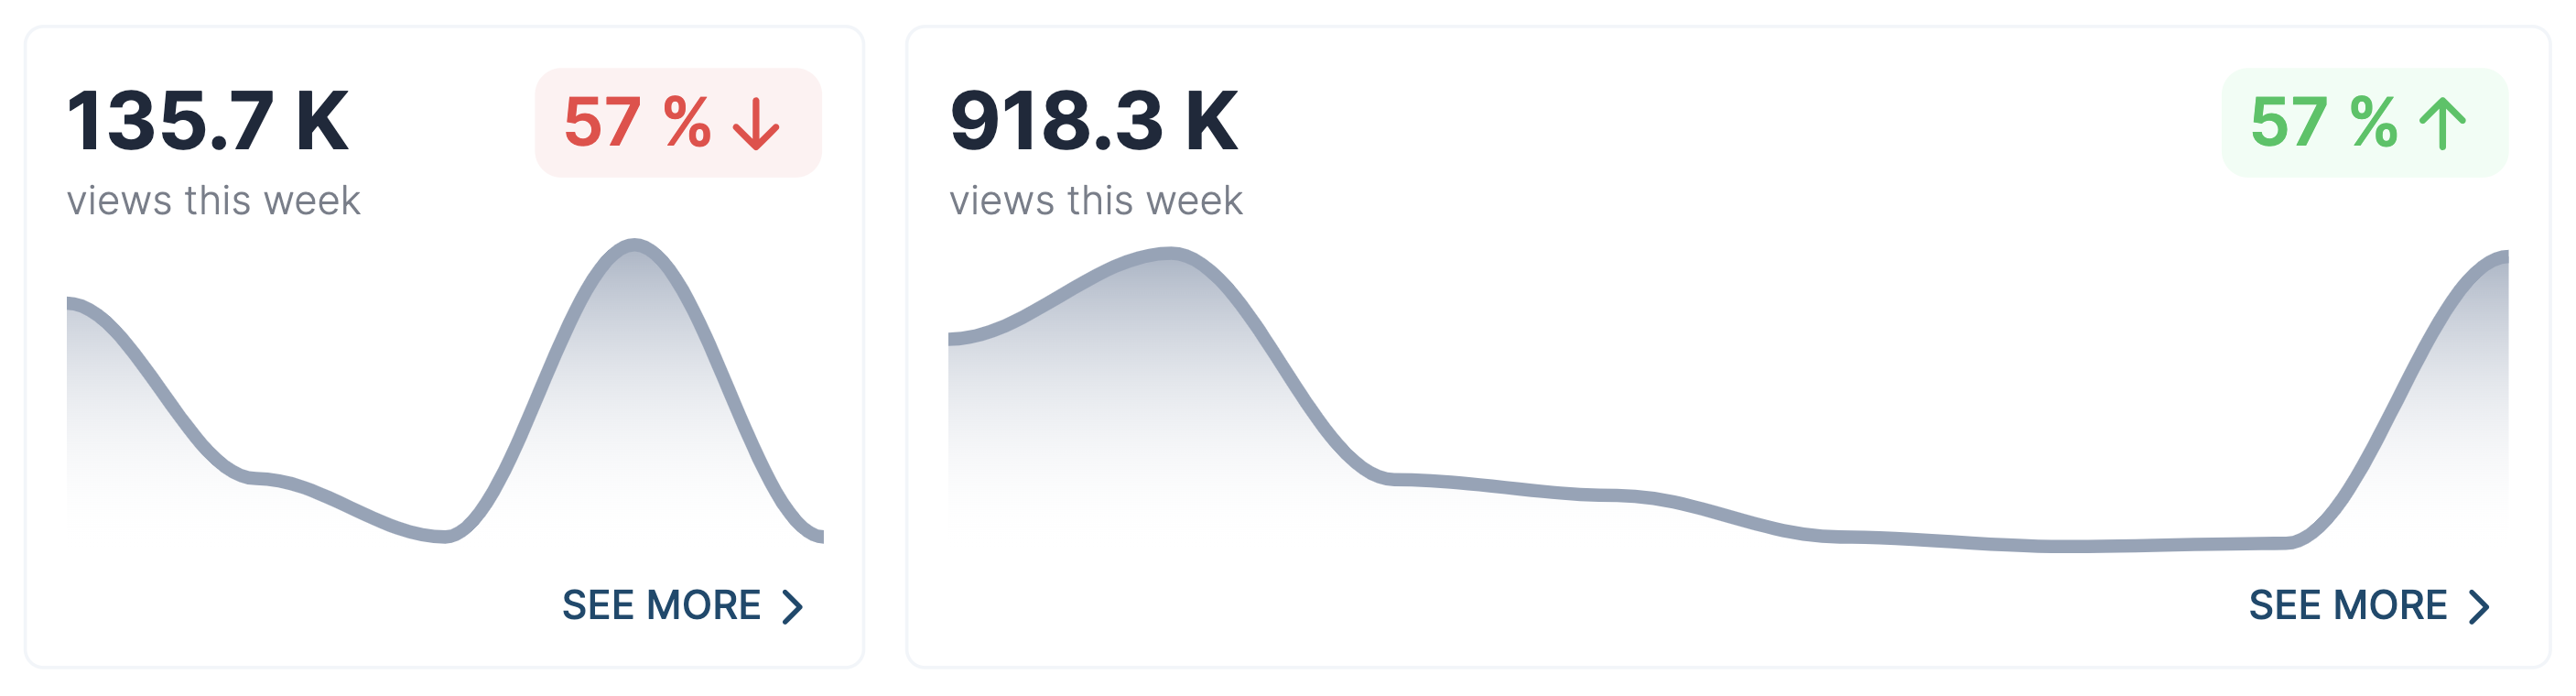
The SparkChart Line component allows you to visualise a data trend using a line graph.
Example JSON
Below is an example of the JSON required to define the component:
{
    "type": "SparkChart.Line",
    "options": {
        "width": "1/3",
        "data": [67, 34, 23, 78, 23],
        "title": "135.7 K",
        "subtitle": "views this week",
        "perc_change": "-",
        "perc_diff": 57,
        "button_link": "https://www.google.com",
        "button_text": "See more"
    }
}
Options
| Key | Description |
|---|---|
data | List of integers, corresponding to Y-values on the chart. |
title | Typically used to show the latest numerical value from the data. |
subtitle | Often used to describe the value or provide units. |
Example
Missing something?
Hybiscus is continuously improving and adding new features. If you think we are missing a critical feature, please do not hesitate to contact us and offer your feedback at support@hybiscus.dev